
Geologic Mapping in the Southern Pacific Border and Sierras provinces, California Active
San Andreas Fault
This project uses geologic and geophysical mapping to build an earth-science framework for scientific investigations that include assessments of critical resources, such as groundwater, and of hazards, such as those resulting from earthquakes, in California west of and including the Sierra Nevada and Cascade arc.
Questions of particular interest include:
What are the geometries, slip rates, and connectivity of faults throughout the broader San Andreas fault system? How do these faults affect resource quantity and quality? How do these factors contribute to the behavior of faults as earthquake sources?
How have basins and landscapes evolved through time? How has this evolution affected resource quantity and quality? Can we use this knowledge to better understand processes related to hazards and resources?
How are rocks and sediments of different properties distributed at the Earth’s surface and in the upper crust? How does this distribution affect resource quantity and quality? How does this distribution affect propagation of seismic energy and ground shaking?
Science Issue and Relevance
Earthquakes, Faulting and Tectonics
Determining how fast faults move through time, how they are connected at depth and at the surface, the style of deformation, and the distribution of rocks with different densities and seismic velocities relate directly to societally relevant questions of how to forecast shaking damage, the size of potential earthquakes, and where faults may rupture.
Basin stratigraphy, structure, and resources
Basins preserve the record of the tectonic evolution, unroofing and sedimentation of California; their structural and stratigraphic underpinnings are essential components for understanding availability and quality of natural resources, particularly water, oil, and gas, as well as understanding how seismic energy propagates in the subsurface and basin effects that concentrate shaking in certain areas.
Surface and Groundwater Resources
Surface water and groundwater serve as water supplies for urban populations, agriculture, and native habitats within California. The combination of rapid population growth, high water use, and arid climate has led to an increased dependence on groundwater resources, resulting in locally severe groundwater depletion and declining groundwater levels. Management of surface-water and groundwater resources in the province requires knowledge of the groundwater system, which in turn requires an understanding of the configuration and properties of aquifers. Such understanding includes the delineation of water-bearing units on the basis of lithology and hydraulic properties, and the construction of 2D and 3D hydrogeologic frameworks.
Methodology to Address Issue:
New geologic mapping will build on previous studies to address topical research problems with collaborating partners. New mapping and compilation will be at various scales (from 1:24,000 to 1:400,000), chosen as appropriate for the purpose of the mapping. Geologic mapping will be augmented by a variety of supporting information including whole-rock geochemistry and paleomagnetic data. Geochronology, such as argon dating, uranium-lead dating, thermochronology, microstratigraphy, and cosmogenic techniques, is essential to date offset features that provide slip rates as well as document timing of uplift. Petrography and microstructural studies of fault and associated mélange rocks are critical methods to translate mapped units to properties that influence fault behavior.

To project these data into the subsurface, geologic cross sections and geophysical data (such as gravity, magnetic, microearthquakes, well data) are essential. For 3D geologic mapping focused on addressing ground-water issues, work will be at the basin scale and focused on water-bearing strata in the upper 1-2 km of the crust. This will involve such elements as defining basin stratigraphy, creating digital 3D distribution of permeabilities and other properties, predicting the location and influence of faults, and evaluating basin evolution within the overall tectonic framework of the region. Techniques used will include geophysical methods (such as gravity and magnetic), basin stratigraphic analysis, structural analysis, and the constraints of regional tectonostratigraphic settings. Digital 3D models can better use semiquantitative geologic data in a predictive sense to build a parameterized model of an aquifer system. GIS and 3D methods of data visualization and analysis will be employed for overlaying and interpreting multiple data sets.

For regional 3D geologic maps focused on addressing seismic hazards, we look to improve the standard methodology in several ways, including subdivision of basement using gravity/magnetic models, using additional stratigraphic horizons to guide and constrain seismic velocity interpolation, and creating seamless 3D models. To assess the robustness of the geologic and velocity models, we will develop ways to compare and analyze various tomographic and 3D seismic velocity models derived from the 3D geologic maps and make data-intensive calculations more efficient.
Results:
2-D geologic map compilations
2-D geologic map compilations integrate the best available mapping across a large area of regional interest. This integrated depiction of the distribution and orientation of geologic materials and structures at the Earth's surface provides vital input into both the basin-scale and the upper-crustal scale 3-D geologic maps, as well as directly informing regional questions of fault interconnectivity, long-term slip history, and sense of offset.

3-D hydrogeologic frameworks:
3-D hydrogeologic frameworks include the shape of the groundwater basin (often modeled using gravity data), faults that bound and pass through the basin deposits, and stratigraphic and textural information. Examples of hydrogeologic frameworks produced from an earlier incarnation of this project include the Cuyama Basin (north of Santa Barbara) and the Santa Rosa Plain (northern San Francisco Bay area). Because of the Sustainable Groundwater Management Act (SGMA) passed by the California state legislature in 2014, increased demand for these frameworks for groundwater modeling has led to work that spans much of California from the Eel River basin near Eureka in the north to the San Antonio basin near Vandenberg Air Force base in the south.

Using mapping to understand how certain rock types affect how faults slip:
Along the boundary between the Central Valley and the northern California Coast Ranges, rocks have been uplifted to expose old fault zones that are lined with highly sheared serpentinite (the state rock of California). Elsewhere, undeformed and unserpentinized parent rock (which once underlaid an ancient ocean) is exposed. By mapping the textures of these rocks one can infer how these rocks became weaker as the rocks were dissolved, broken up and crushed, and began to shear and slip, with implications of how this process changes the strength of the fault through time.

Where does right-lateral slip go east of the Sierra Nevada?
The San Andreas fault is the most famous member of a system of faults that accommodate right-lateral slip between the North America and Pacific tectonic plates, but other faults can be just as important, especially when they cause large earthquakes. On the east side of the Sierra Nevada is a system of right-lateral and extensional faults called the Walker Lane. Where this slip goes north of Lassen volcano is the subject of debate. We use remote sensing of the magnetic properties of rocks to look the amount of right-lateral offset, such as for the area north of Burney Falls (shown in map below).

Development of 3D geologic and property models:

In the Sacramento Delta of northern California, bringing together relationships of geologic units mapped at the surface, descriptions of rock types encountered in gas wells, logs of electrical and seismic velocity, and geophysical data such as gravity and magnetic data lays a foundation for building a 3D model of the geology. Such a model consists of surfaces of major faults (top panel) and various geologic map units into various flavors of basin fill and basement rocks (middle panel). The 3D model becomes the framework for assigning seismic velocities (how fast sound energy propagates through these rocks) to the subsurface (bottom panel) that can be used to predict ground shaking from future earthquakes.
- Overview
This project uses geologic and geophysical mapping to build an earth-science framework for scientific investigations that include assessments of critical resources, such as groundwater, and of hazards, such as those resulting from earthquakes, in California west of and including the Sierra Nevada and Cascade arc.
Questions of particular interest include:
What are the geometries, slip rates, and connectivity of faults throughout the broader San Andreas fault system? How do these faults affect resource quantity and quality? How do these factors contribute to the behavior of faults as earthquake sources?
How have basins and landscapes evolved through time? How has this evolution affected resource quantity and quality? Can we use this knowledge to better understand processes related to hazards and resources?
How are rocks and sediments of different properties distributed at the Earth’s surface and in the upper crust? How does this distribution affect resource quantity and quality? How does this distribution affect propagation of seismic energy and ground shaking?
Science Issue and Relevance
Earthquakes, Faulting and Tectonics
Determining how fast faults move through time, how they are connected at depth and at the surface, the style of deformation, and the distribution of rocks with different densities and seismic velocities relate directly to societally relevant questions of how to forecast shaking damage, the size of potential earthquakes, and where faults may rupture.
Basin stratigraphy, structure, and resources
Basins preserve the record of the tectonic evolution, unroofing and sedimentation of California; their structural and stratigraphic underpinnings are essential components for understanding availability and quality of natural resources, particularly water, oil, and gas, as well as understanding how seismic energy propagates in the subsurface and basin effects that concentrate shaking in certain areas.
Surface and Groundwater Resources
Surface water and groundwater serve as water supplies for urban populations, agriculture, and native habitats within California. The combination of rapid population growth, high water use, and arid climate has led to an increased dependence on groundwater resources, resulting in locally severe groundwater depletion and declining groundwater levels. Management of surface-water and groundwater resources in the province requires knowledge of the groundwater system, which in turn requires an understanding of the configuration and properties of aquifers. Such understanding includes the delineation of water-bearing units on the basis of lithology and hydraulic properties, and the construction of 2D and 3D hydrogeologic frameworks.
Methodology to Address Issue:
New geologic mapping will build on previous studies to address topical research problems with collaborating partners. New mapping and compilation will be at various scales (from 1:24,000 to 1:400,000), chosen as appropriate for the purpose of the mapping. Geologic mapping will be augmented by a variety of supporting information including whole-rock geochemistry and paleomagnetic data. Geochronology, such as argon dating, uranium-lead dating, thermochronology, microstratigraphy, and cosmogenic techniques, is essential to date offset features that provide slip rates as well as document timing of uplift. Petrography and microstructural studies of fault and associated mélange rocks are critical methods to translate mapped units to properties that influence fault behavior.
Sources/Usage: Public Domain. View Media DetailsGeologists comparing existing geologic maps with the outcrop behind them and evaluating the evidence for how these rocks near Point Piedras Blancas along the California coast arrived at their present state-essentially sedimentary rocks that were deposited horizontally now dipping at a near-vertical attitude. Researchers have suggested that these rocks were once adjacent to simiar rocks exposed near Point Sal ~55 miles to the south and translated into their current position by the San Gregorio-Hosgri fault zone. To project these data into the subsurface, geologic cross sections and geophysical data (such as gravity, magnetic, microearthquakes, well data) are essential. For 3D geologic mapping focused on addressing ground-water issues, work will be at the basin scale and focused on water-bearing strata in the upper 1-2 km of the crust. This will involve such elements as defining basin stratigraphy, creating digital 3D distribution of permeabilities and other properties, predicting the location and influence of faults, and evaluating basin evolution within the overall tectonic framework of the region. Techniques used will include geophysical methods (such as gravity and magnetic), basin stratigraphic analysis, structural analysis, and the constraints of regional tectonostratigraphic settings. Digital 3D models can better use semiquantitative geologic data in a predictive sense to build a parameterized model of an aquifer system. GIS and 3D methods of data visualization and analysis will be employed for overlaying and interpreting multiple data sets.
Sources/Usage: Public Domain. View Media DetailsGeologist measuring the dip of sedimentary strata near Pinnacles National Park. These rocks are part of the Bickmore Canyon Formation, a late Miocene deposit that currently resides on the west side of the San Andreas fault. The big blocks of granite and volcanic rock on the left side of the photograph indicate that this outcrop formed close to a scarp or cliff that shed debris eastward across the fault. The equivalent material on the east side of the fault, called the Santa Margarita Formation, is now located in the Temblor Range, some 100 miles to the southeast. Measuring the dip of these strata is the first step in projecting these rocks into the subsurface and understanding tectonic forces that have deformed them, the same forces that cause destructive earthquakes in the region.
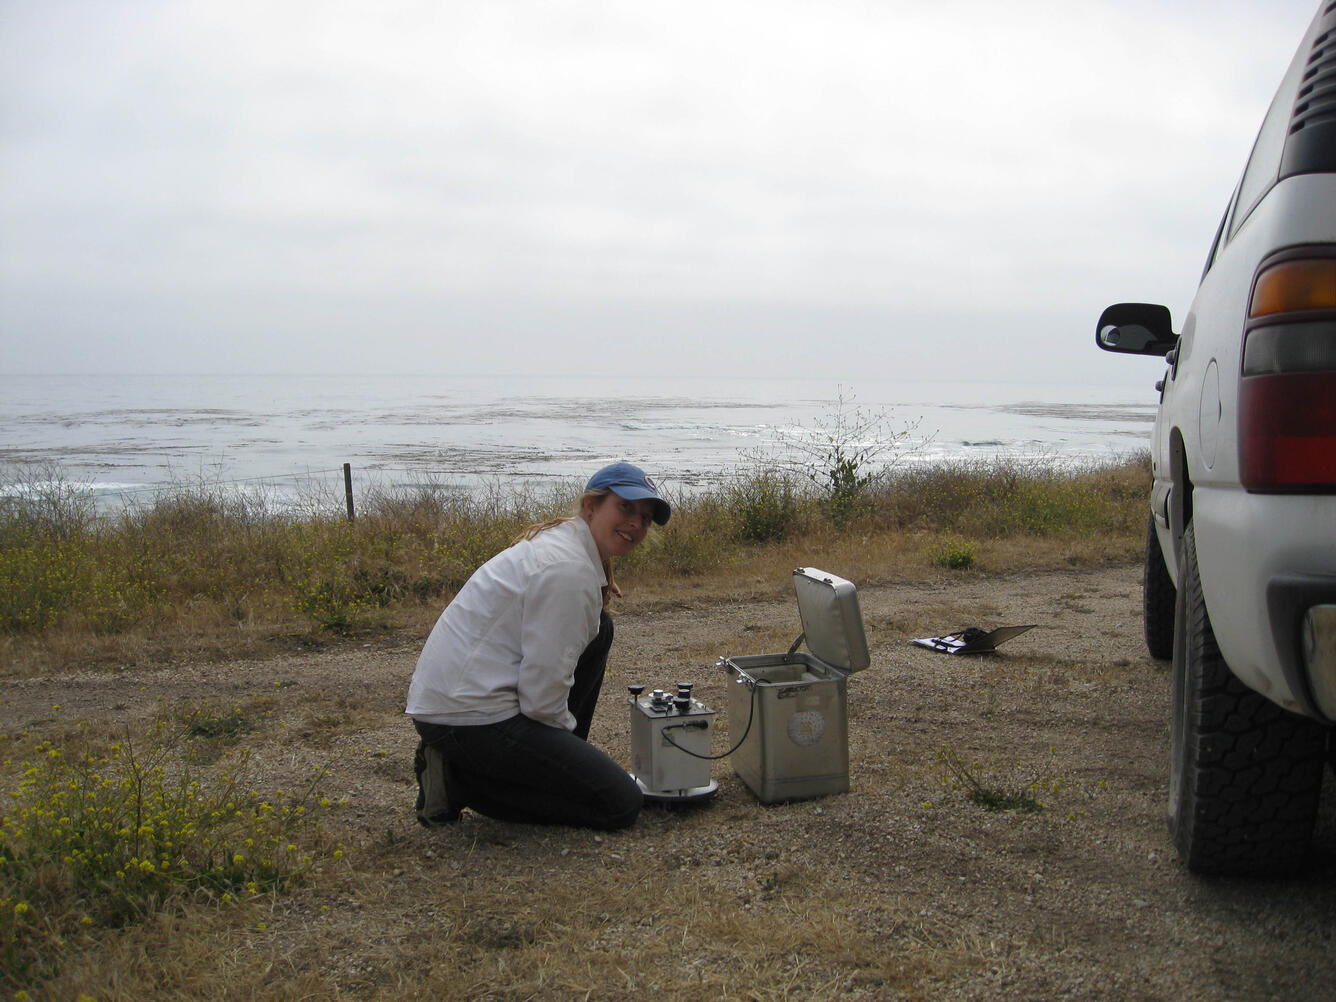
Sources/Usage: Public Domain. View Media DetailsResearch Geophysicist measuring gravity near Point Buchon, coastal California. The instrument measures very small variations of the Earth's gravity field, which can then be processed to reflect variations of the Earth's gravity field, which can then be processed to reflect variations in rock density within the Earth's crust. This technique is useful for identifying faults that may not be easily mapped at the surface because of urbanization or very young deposits and for mapping the shape of sedimentary basins. For regional 3D geologic maps focused on addressing seismic hazards, we look to improve the standard methodology in several ways, including subdivision of basement using gravity/magnetic models, using additional stratigraphic horizons to guide and constrain seismic velocity interpolation, and creating seamless 3D models. To assess the robustness of the geologic and velocity models, we will develop ways to compare and analyze various tomographic and 3D seismic velocity models derived from the 3D geologic maps and make data-intensive calculations more efficient.
Results:
2-D geologic map compilations
2-D geologic map compilations integrate the best available mapping across a large area of regional interest. This integrated depiction of the distribution and orientation of geologic materials and structures at the Earth's surface provides vital input into both the basin-scale and the upper-crustal scale 3-D geologic maps, as well as directly informing regional questions of fault interconnectivity, long-term slip history, and sense of offset.
Sources/Usage: Public Domain. View Media DetailsMap showing the geologic complexity of the central California Coast Ranges from the offshore San Gregorio0-Hosgri fault inland to the San Andreas fault. 3-D hydrogeologic frameworks:
3-D hydrogeologic frameworks include the shape of the groundwater basin (often modeled using gravity data), faults that bound and pass through the basin deposits, and stratigraphic and textural information. Examples of hydrogeologic frameworks produced from an earlier incarnation of this project include the Cuyama Basin (north of Santa Barbara) and the Santa Rosa Plain (northern San Francisco Bay area). Because of the Sustainable Groundwater Management Act (SGMA) passed by the California state legislature in 2014, increased demand for these frameworks for groundwater modeling has led to work that spans much of California from the Eel River basin near Eureka in the north to the San Antonio basin near Vandenberg Air Force base in the south.
Sources/Usage: Public Domain. View Media DetailsExample of a 3-D model of grain-size variations within basin fill beneath Salinas Valley, California. Grain-size variations affect how fast water can be transmitted in the subsurface, with clay (shades of blue) being the slowest to gravels (shades of brown) being the fastest. Circular columns denote grain-size variations interpreted from lithologic descriptions by water-well drillers. Vertical slices through the model show how grain-size variations were interpolated throughout the basin volume. Using mapping to understand how certain rock types affect how faults slip:
Along the boundary between the Central Valley and the northern California Coast Ranges, rocks have been uplifted to expose old fault zones that are lined with highly sheared serpentinite (the state rock of California). Elsewhere, undeformed and unserpentinized parent rock (which once underlaid an ancient ocean) is exposed. By mapping the textures of these rocks one can infer how these rocks became weaker as the rocks were dissolved, broken up and crushed, and began to shear and slip, with implications of how this process changes the strength of the fault through time.
Sources/Usage: Public Domain. View Media DetailsPhoto on left is serpentinized peridotite, which forms jointed blocky outcrops and is relatively strong. Photo on right is serpentinite melange, which is highly sheared and relatively weak. By mapping the textures of these rocks one can infer how these rocks became weaker as the rocks were dissolved, broken up and crushed, and began to shear and slip, with implications of how this process changes the strength of the fault through time. Where does right-lateral slip go east of the Sierra Nevada?
The San Andreas fault is the most famous member of a system of faults that accommodate right-lateral slip between the North America and Pacific tectonic plates, but other faults can be just as important, especially when they cause large earthquakes. On the east side of the Sierra Nevada is a system of right-lateral and extensional faults called the Walker Lane. Where this slip goes north of Lassen volcano is the subject of debate. We use remote sensing of the magnetic properties of rocks to look the amount of right-lateral offset, such as for the area north of Burney Falls (shown in map below).
Sources/Usage: Public Domain. View Media DetailsSimplified geologic map (left); red lines are geologically young faults and the white line outlines new aeromagnetic data. Aeromagnetic map (right) based on older data; colors show small variations in the Earth's magnetic field that are caused by rocks that contain magnetic minerals, such as magnetite. Arrows point to a linear feature that is not offset by faults (shown in black). New detailed data will allow us to map in more detail how much right-lateral offset is possible on these faults within the white line. Development of 3D geologic and property models:
Sources/Usage: Public Domain. View Media DetailsVarious views of a 3-dimensional geologic model of the Sacramento Delta area, California. Upper panel shows major fault surfaces, middle panel shows Neogene (green) and Cretaceous(brown) basin In the Sacramento Delta of northern California, bringing together relationships of geologic units mapped at the surface, descriptions of rock types encountered in gas wells, logs of electrical and seismic velocity, and geophysical data such as gravity and magnetic data lays a foundation for building a 3D model of the geology. Such a model consists of surfaces of major faults (top panel) and various geologic map units into various flavors of basin fill and basement rocks (middle panel). The 3D model becomes the framework for assigning seismic velocities (how fast sound energy propagates through these rocks) to the subsurface (bottom panel) that can be used to predict ground shaking from future earthquakes.
- Data
- Maps
- Publications
- Software
- Partners